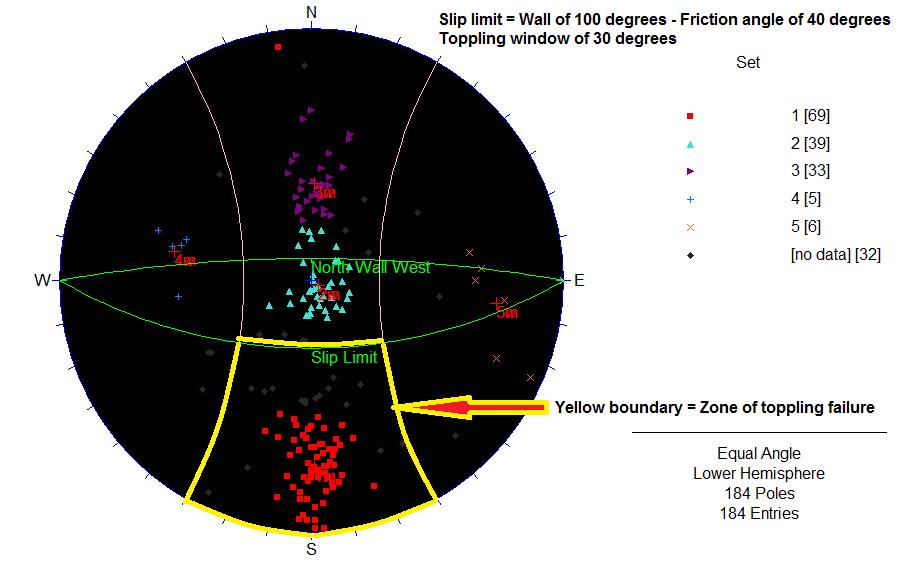
For the kinematic analysis, joint sets generated by point cloud processing were used in a geological orientation graphical and statistical analysis program (Rocscience, 2011) to evaluate the probability of toppling from the north wall as the main reason for the talus/scree slope. A moderately strong joint friction angle of 40° was chosen due to calcite cementation in some joints. Based on the analysis shown in Figure 10 below, we feel certain that toppling failures produce regular rockfall under this overhanging face.
Two-dimensional numerical modeling (Rocscience, 2011) analysis using a point cloud cross-section yields insight into collapse patterns. Based on the shallow depth of the cave and present-day conditions, the initial modeling results showed very little stress, deformation or fractured rock beams. Because the cave is proximal to the epicenter of the 7.4 magnitude, 1887 northeastern Sonoran, Mexico, earthquake, and because shallow caves can be impacted by seismicity, an analysis with a seismic coefficient of 0.1 was chosen based on seismic probability maps (Natali and Sbar, 1982; www.edgetech-us.com, 2012; www.landfilldesign.com, 2012; Melo and Sharma, 2004). After adding a seismic coefficient, the results changed significantly – separation of roof beams showed failure and displacements up to 25 cm (Figure 11).
As a check on the accuracy of our analysis of Coronado Cave, the geometric measurements of Coronado Cave’s roof span and hydraulic radius were plotted on an underground mining Modified Stability graph (Johnson et al., 2000) to assess its general stability. The cave falls on the boundary of the stable and transition zones (Fig. 12). This indicates that underground rooms of these dimensions are mostly stable but transition into the region where cave-ins occur. This assessment is congruent with the presence of fallen blocks present and supports the 2D stress and deformation modeling results.
Our research indicates that Coronado Cave is presently mostly stable, but sizable earthquakes could lead to rock failure. The modeling results displayed low stresses and deformations under present in situ conditions, but failure was demonstrated during modeling of a moderate seismic event. Only the kinematic analysis for toppling from the walls of the north face of the west room showed current instability in the form of small block falls forming a scree slope; this appears to be the only section of the cave where visitors should avoid prolonged exposure. Further field work will be conducted to obtain a more thorough evaluation by collecting more direct rock mass properties such as friction angles and joint infill materials.
Future research will attempt to determine the rates of current and future cave breakdown processes; this is the primary scientific objective of this project. Through the use of time-dependent fracture mechanics methods, probabilities of rock failure can be projected into the future based on the current condition of the intact rock and of the rock bridges in the joints that bind rock beams together. One of the challenges retrieving accurate results with time-dependent failure predictions is definitively characterizing partially concealed rock bridges that support rock beams. We propose that modal frequency measurements of rock beams in combination with 3D stress analysis modeling can be used to determine rock bridge geometries and distributions along joints that currently support beams (Kemeny, 2004; Kemeny and Kim, 2009). Accelerometer readings have already been recorded for vibrational analysis of the rock formations and beams in the cave (Figure 13), and the geometries required for accurate 3D modeling of critical rock beams can be easily obtained from the LiDAR data. In addition to using future failure calculations to determine cave breakdown rates, establishing the failure times of the existing fallen blocks could allow for correlation and calibration of the fracture mechanics models being tested. The challenge here is the difficulty of dating fracture surfaces of breakdown blocks.
LiDAR has proved valuable in obtaining abundant and accurate data for use in the stability analysis of Coronado Cave. Repeated scans in caves over time can yield mass wasting, depositional and erosional rates of change, increasing our knowledge of cave evolution. Cave scans can be tied to the surface and incorporated into Geographic Information Systems (GIS) databases for mapping and spatial analysis. As TLS devices become smaller and more mobile, more constricted and longer caves can be studied. Research using LiDAR in caves in conjunction with GIS spatial analysis of the surface and subsurface could provide insight into how and where cave-related karst features and hazards manifest both in the subsurface and on the surface.


